The Evidence
The following charts provide empirical support for the Capital-Consumption Theory and the 80-year economic cycle between growth and stagnation attractors.
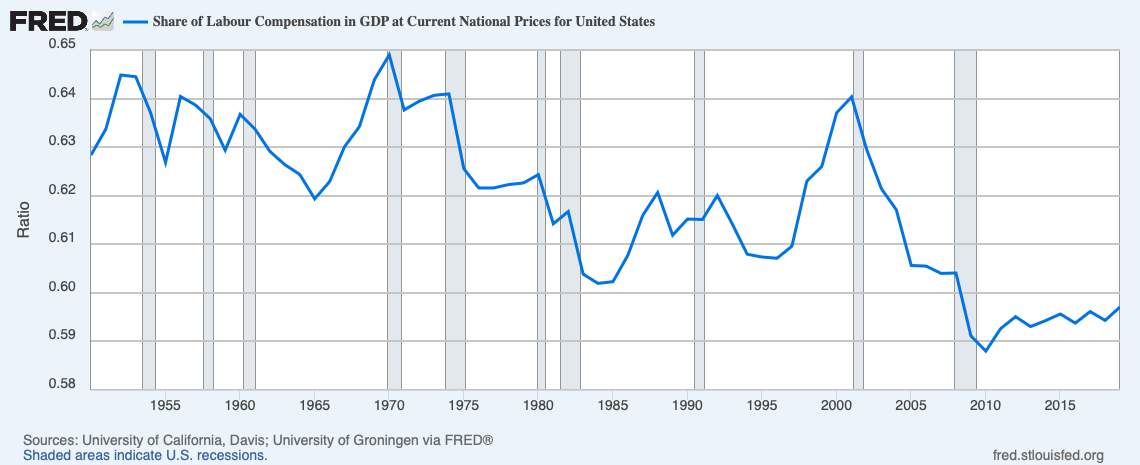
Labor Share of Income (1940-Present)
This chart shows the declining portion of GDP going to workers during the stagnation phase (post-1980). This supports our theory's prediction about the shift from labor to capital during stagnation periods.
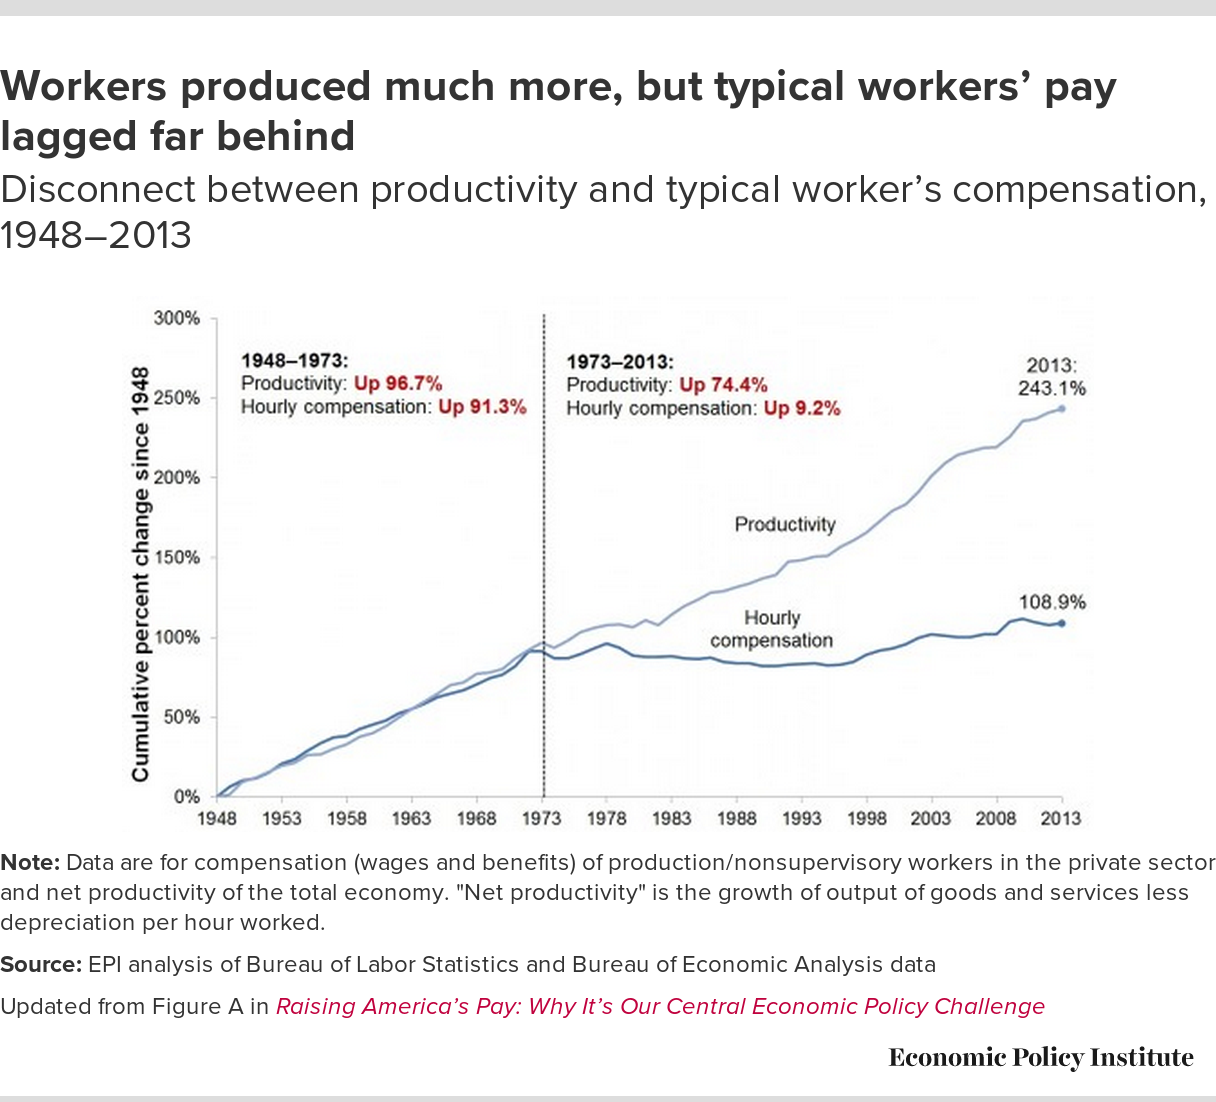
Wage-Productivity Gap
This chart demonstrates how wages stopped "sufficiently growing" relative to productivity starting in the 1970s, a key indicator of the transition from the growth attractor to the stagnation attractor.
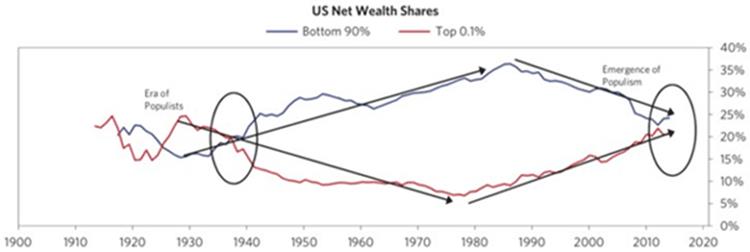
Rising Inequality
Income inequality has risen dramatically during the stagnation period, consistent with our theory's predictions about income distribution patterns during different phases of the 80-year cycle.
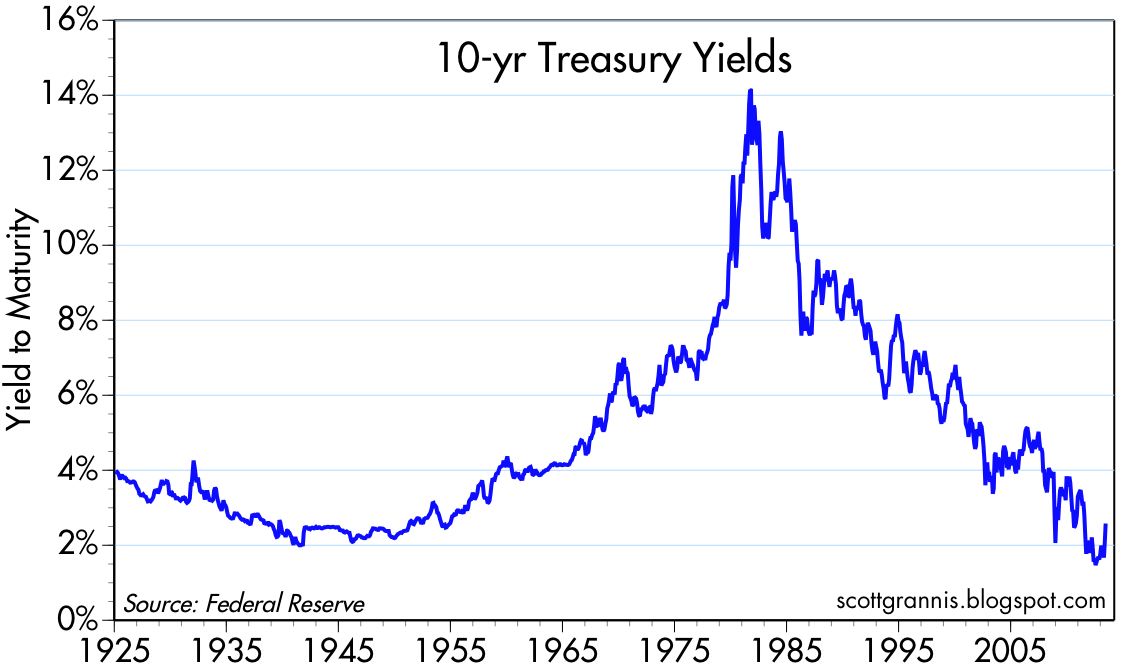
Long-term Interest Rate Trends
The declining interest rates during the stagnation phase support our theory's claim about capital surplus effects when the economy is in the stagnation attractor.
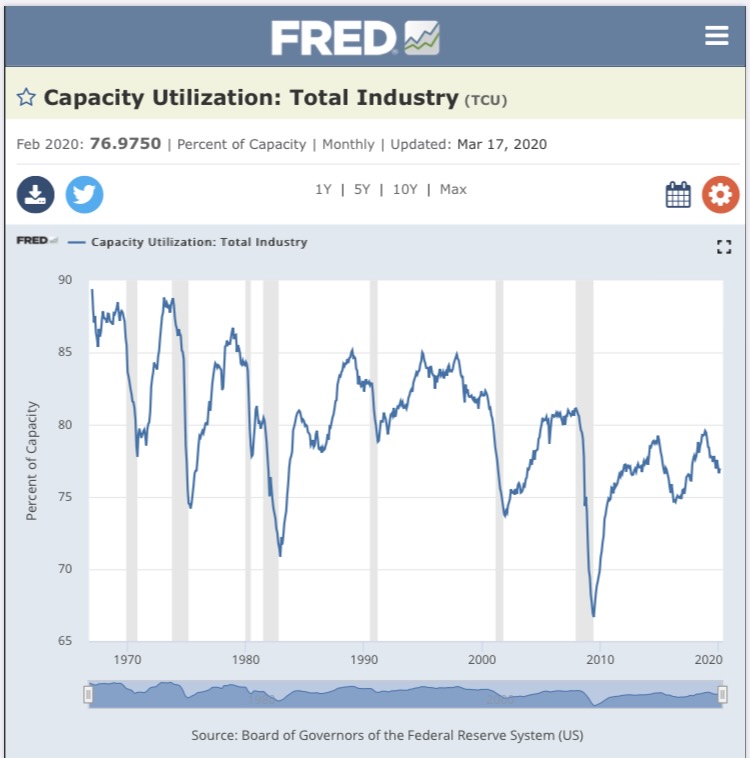
Capacity Utilization Trends
This chart shows declining capacity utilization during the stagnation phase, demonstrating economic underperformance when wages and aggregate demand fail to keep pace with productivity growth.
What This Evidence Tells Us
These economic indicators collectively support the Capital-Consumption Theory's core claim: that the economy oscillates between growth and stagnation attractors in an approximately 80-year cycle. The transition from the post-WWII growth period to the post-1980 stagnation period is clearly visible across multiple economic measures.
The data shows how "sufficiently growing" wages relative to productivity are essential for maintaining the growth attractor state. When this relationship breaks down, as it did in the 1970s, the economy shifts to the stagnation attractor characterized by rising inequality, falling labor share, declining interest rates, and underutilized capacity.